Soccer Tracking - Part 4 - Reidentification
As mentioned way back at the end of part 1 one of the challenges and downsides of using TV broadcasts to track players is that not all players will be in frame at all times and there will be ads and replays which will require reidentification. In computer vision, reidentification is the problem of identifying the same object throughout a video sequence even if the object goes out of frame, is occluded or is lost to the object tracker for any other reason. Reidentification can also refer to the process of determining whether objects tracked by multiple cameras are actually the same object.
One approach to reidentification outlined in this paper is to extract and store features of objects as they are being tracked. When a new object appears we can then compare the features of the new object with the features of previously tracked, but not currently active, objects to determine if the new object is the same as one of the previous objects. To generate the features, the paper suggests using one of the hidden layer activations from ResNet, a model trained for image classification. This works because the hidden layers of ResNet will learn how to extract features from an image that are useful for classification. Those same features should also be useful for determinining how similar two images are.
While using image similarity outlined above helps with reidentification for soccer tracking, it doesn’t do a great job on its own. Since all of the players on a team wear the same jersey, there isn’t enough variability in image features. My idea to work around this was to also use each players last known position as well as the distribution of their position throughout the game up until the frame being processed. I annotated the first 10 minutes of Chelsea/Arsenal game to learn how to weight each of the reidentification features. Then ran the whole pipeline on the first half Sheffield United/Man City which wasn’t used to train or evaluate any of the models.
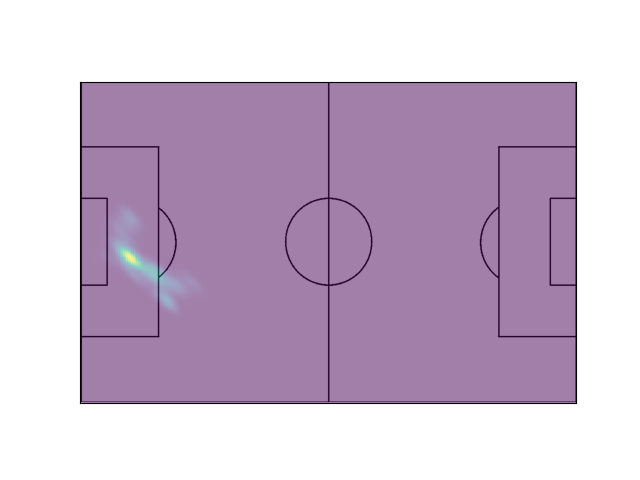
As a sanity check, Ederson’s position heatmap is above. It’s about what you would expect from a goalie and shows that he does step up and out of the box when needed as a sweeper keeper or to help with the build up. A more interesting one from this game is Ake which is below.
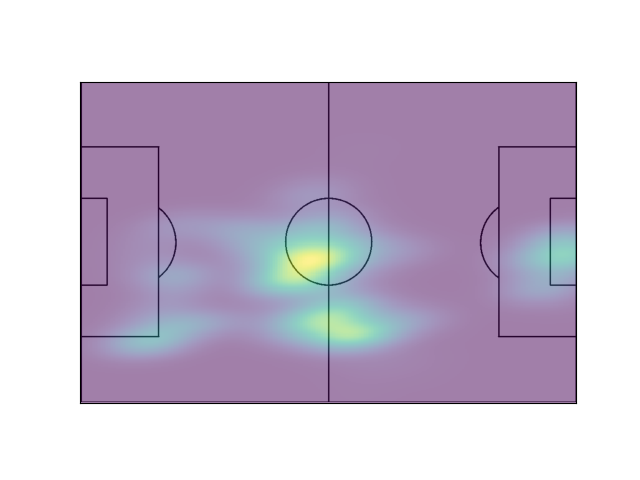
This reveals a couple interesting facts about the game and how City was playing. First off it shows how much City dominated the game in Sheffield United’s half. Ake spent almost the entire half around midfield as City had 80% possession almost all of which was in the attacking third. It also shows how City uses their defenders in possession. This won’t be a surprise as Pep Guardiola is known for playing around with different shapes in and out of possession. In this game the lineup shows City playing a 4-2-3-1 with Ake as the left central defender. The heatmap shows that Ake spent most of his time in the middle of the field or even slightly to the right side. This is because in possession City was going to a back three (Gvardiol, Ake and Dias) with Ake in the middle and Kyle Walker was pushing up to provide attacking width on the right. This can also be seen in Bernardo Silva’s heatmap below.
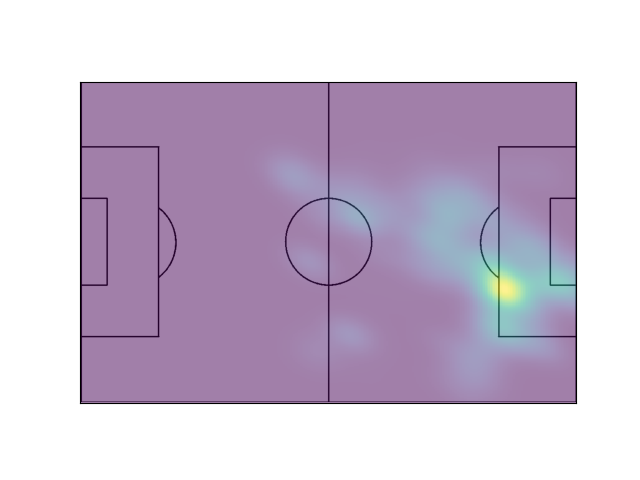
On paper, Bernardo was playing as the right winger but he actually spent most of the game in more central positions. The last heatmap that I found interesting was Haaland’s.
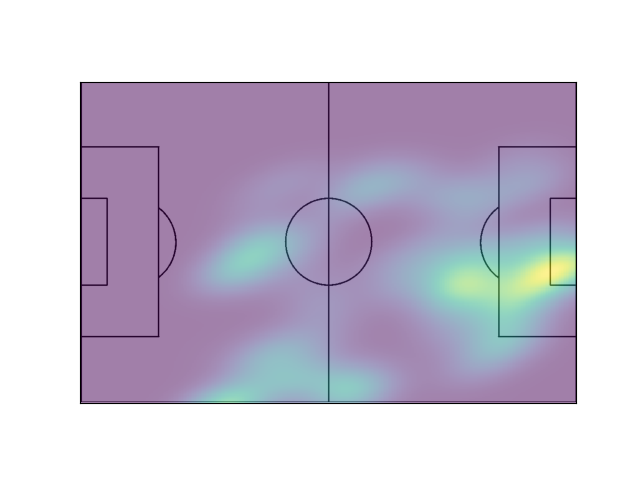
This actually highlights a huge limitation of using TV broadcasts for player tracking. Haaland’s heatmap makes it look like he spent almost the entire half in the Sheffield United 6 yard box. That can’t be true since City weren’t that dominant and Sheffield United’s generally held their defensive line above the 6 yard box. This is mainly due to the fact that using TV broadcasts, there is only position data for players when they are in frame. Haaland spends most of time stuck to the last defender and thus is out of frame for most of City’s build up. When Haaland does come into frame in this game, City are already breaking into the final third, so his heatmap makes it look like he was much deeper than he actually was.
The goal of this project was generate reasonable player position heatmaps. Even though there are limitations to using TV broadcasts, this is a pretty good result. Professional teams do a ton of video analysis using a lot of the techniques in this series of posts. They have the advantage of installing fixed cameras that capture the entire field removing the need for homography estimation and also makes it possible to track players even when they aren’t near the ball. It would be really fun to get access to some of that data, but it’s incredibly valuable understandably kept private.