Soccer Tracking - Part 3 - Improved Homography
The initial end goal of this soccer tracking project was to be able to generate heat maps for each player to show their positioning throughout a game. When I started working on the project I promised myself that I wouldn’t spend too much time on each individual component until that goal was feasible. Each component of the project has obvious ways to improve in the future. For example, object detection and tracking can easily be improved by annotating more images and training the model on more data and homography estimation has many other approaches that could be investigated. So I should have started working on the problem of reidentifying players after they are lost to the tracker due to occlusion, going off screen, a replay or camera angle change, or any other reason. But I wasn’t happy with the homography estimator, so I decided to revisit that component.
The main issue with the homography estimation techinque discussed in the last post was that the estimates it produced could jump around since the number of known camera orientations was limited. The paper has a few ways to address this issue, but I wanted to find another approach that looked more promising. I decided to look into and implement the approach outlined in A Robust and Efficient Framework for Sports-Field Registration and described in this blog post and by the authors in the video below.
Using that approach, a grid of points is drawn on the field and can be used to estimate the homography using the corresponding coordinates for the points on the birds eye view of the field. Using this approach should not have the same issues where the homography changed drastically between frames as long as the model to predict the location of the grid points is doing its job. This model can also be trained on the World Cup dataset (the soccer data link here) which has images annotated with their homography matrix since the grid points can be generated from the homography matrix. As mentioned in the paper, this method doesn’t suffer from the issue of other keypoint detection approaches that can’t predict the homography when there aren’t enough keypoints detected. This is particularly an issue in soccer since there is are no lines (and thus no keypoints) between the 18 yard box and the center circle and there are many frames in broadcasts that capture that area.


Examples of frames that wouldn’t be able to estimate homography using a keypoint method using field line intersections.
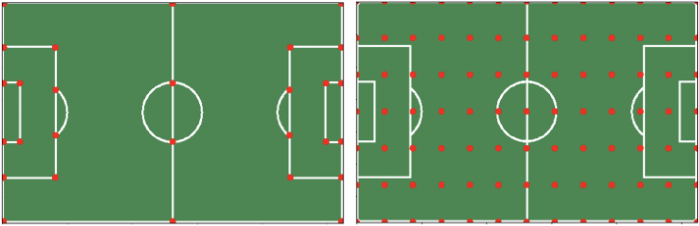
Keypoints using field line intersections and the grid of points used in A Robust and Efficient Framework for Sports-Field Registration.
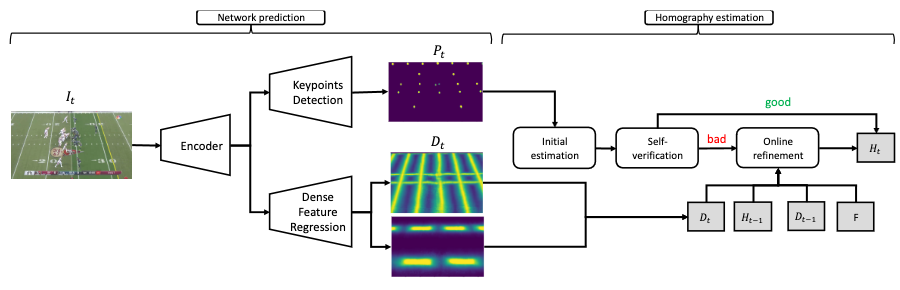
The full pipeline for this approach is below. In the spirit of not spending too much time on any individual component of this project, I only implemented the model to do keypoint detection and the initial homography estimation. Implementing the dense feature regression and online homography refinement will have to wait and also provides some confidence that this approach can be improved. Also it’s important to note that the full online homography refinement is not possible to train with the World Cup dataset since the frames are not consecutive and thus the differences between frames’ dense feature sets and relative homography can’t be computed.
The first step of the pipeline is the model to draw the grid points on the field. The result of that for the Arsenal and Chelsea match that I used in the previous post about homography can be seen below.
There is more noise in the keypoint predictions than the keypoints in the American football video in the paper authors’ blog post. This is most likely due to American football having more field markings which makes the keypoints easier to place and could also be influenced by the limited training data used to train the model. The World Cup dataset only has 209 training images (which were augmented with horizontal flips and slight rotation and shear warping) whereas the SportsField dataset used by the paper authors has nearly double the soccer training images. The video mentions that they are planning on publicly releasing the dataset, but I haven’t been able to find it.
After predicting the location of the grid points in a video frame, the homography matrix can be estimated using the coordinates of the corresponding points in the birds eye view plane. Then combining this with the object tracker we can plot the locations of all of the players.
And to show the improvement between the models the clip below shows the projection of the field lines from the predicted homography from both approaches. Clearly the one on the right using the model in A Robust and Efficient Framework for Sports-Field Registration is a better estimate.
Field lines drawn using the homography estimates from Sports Camera Calibration via Synthetic Data in the middle and A Robust and Efficient Framework for Sports-Field Registration on the right.